Headshot of Alex Chohlas-Wood in a blue blazer against a red background.
I'm an assistant professor of computational social science at NYU's Department of Applied Statistics, Social Science, and Humanities. I investigate how computational approaches can improve public policy in applied collaborations with government agencies. I also co-direct the Computational Policy Lab (CPL) at Harvard Kennedy School. Here's what I've been up to recently:
  • Blind charging

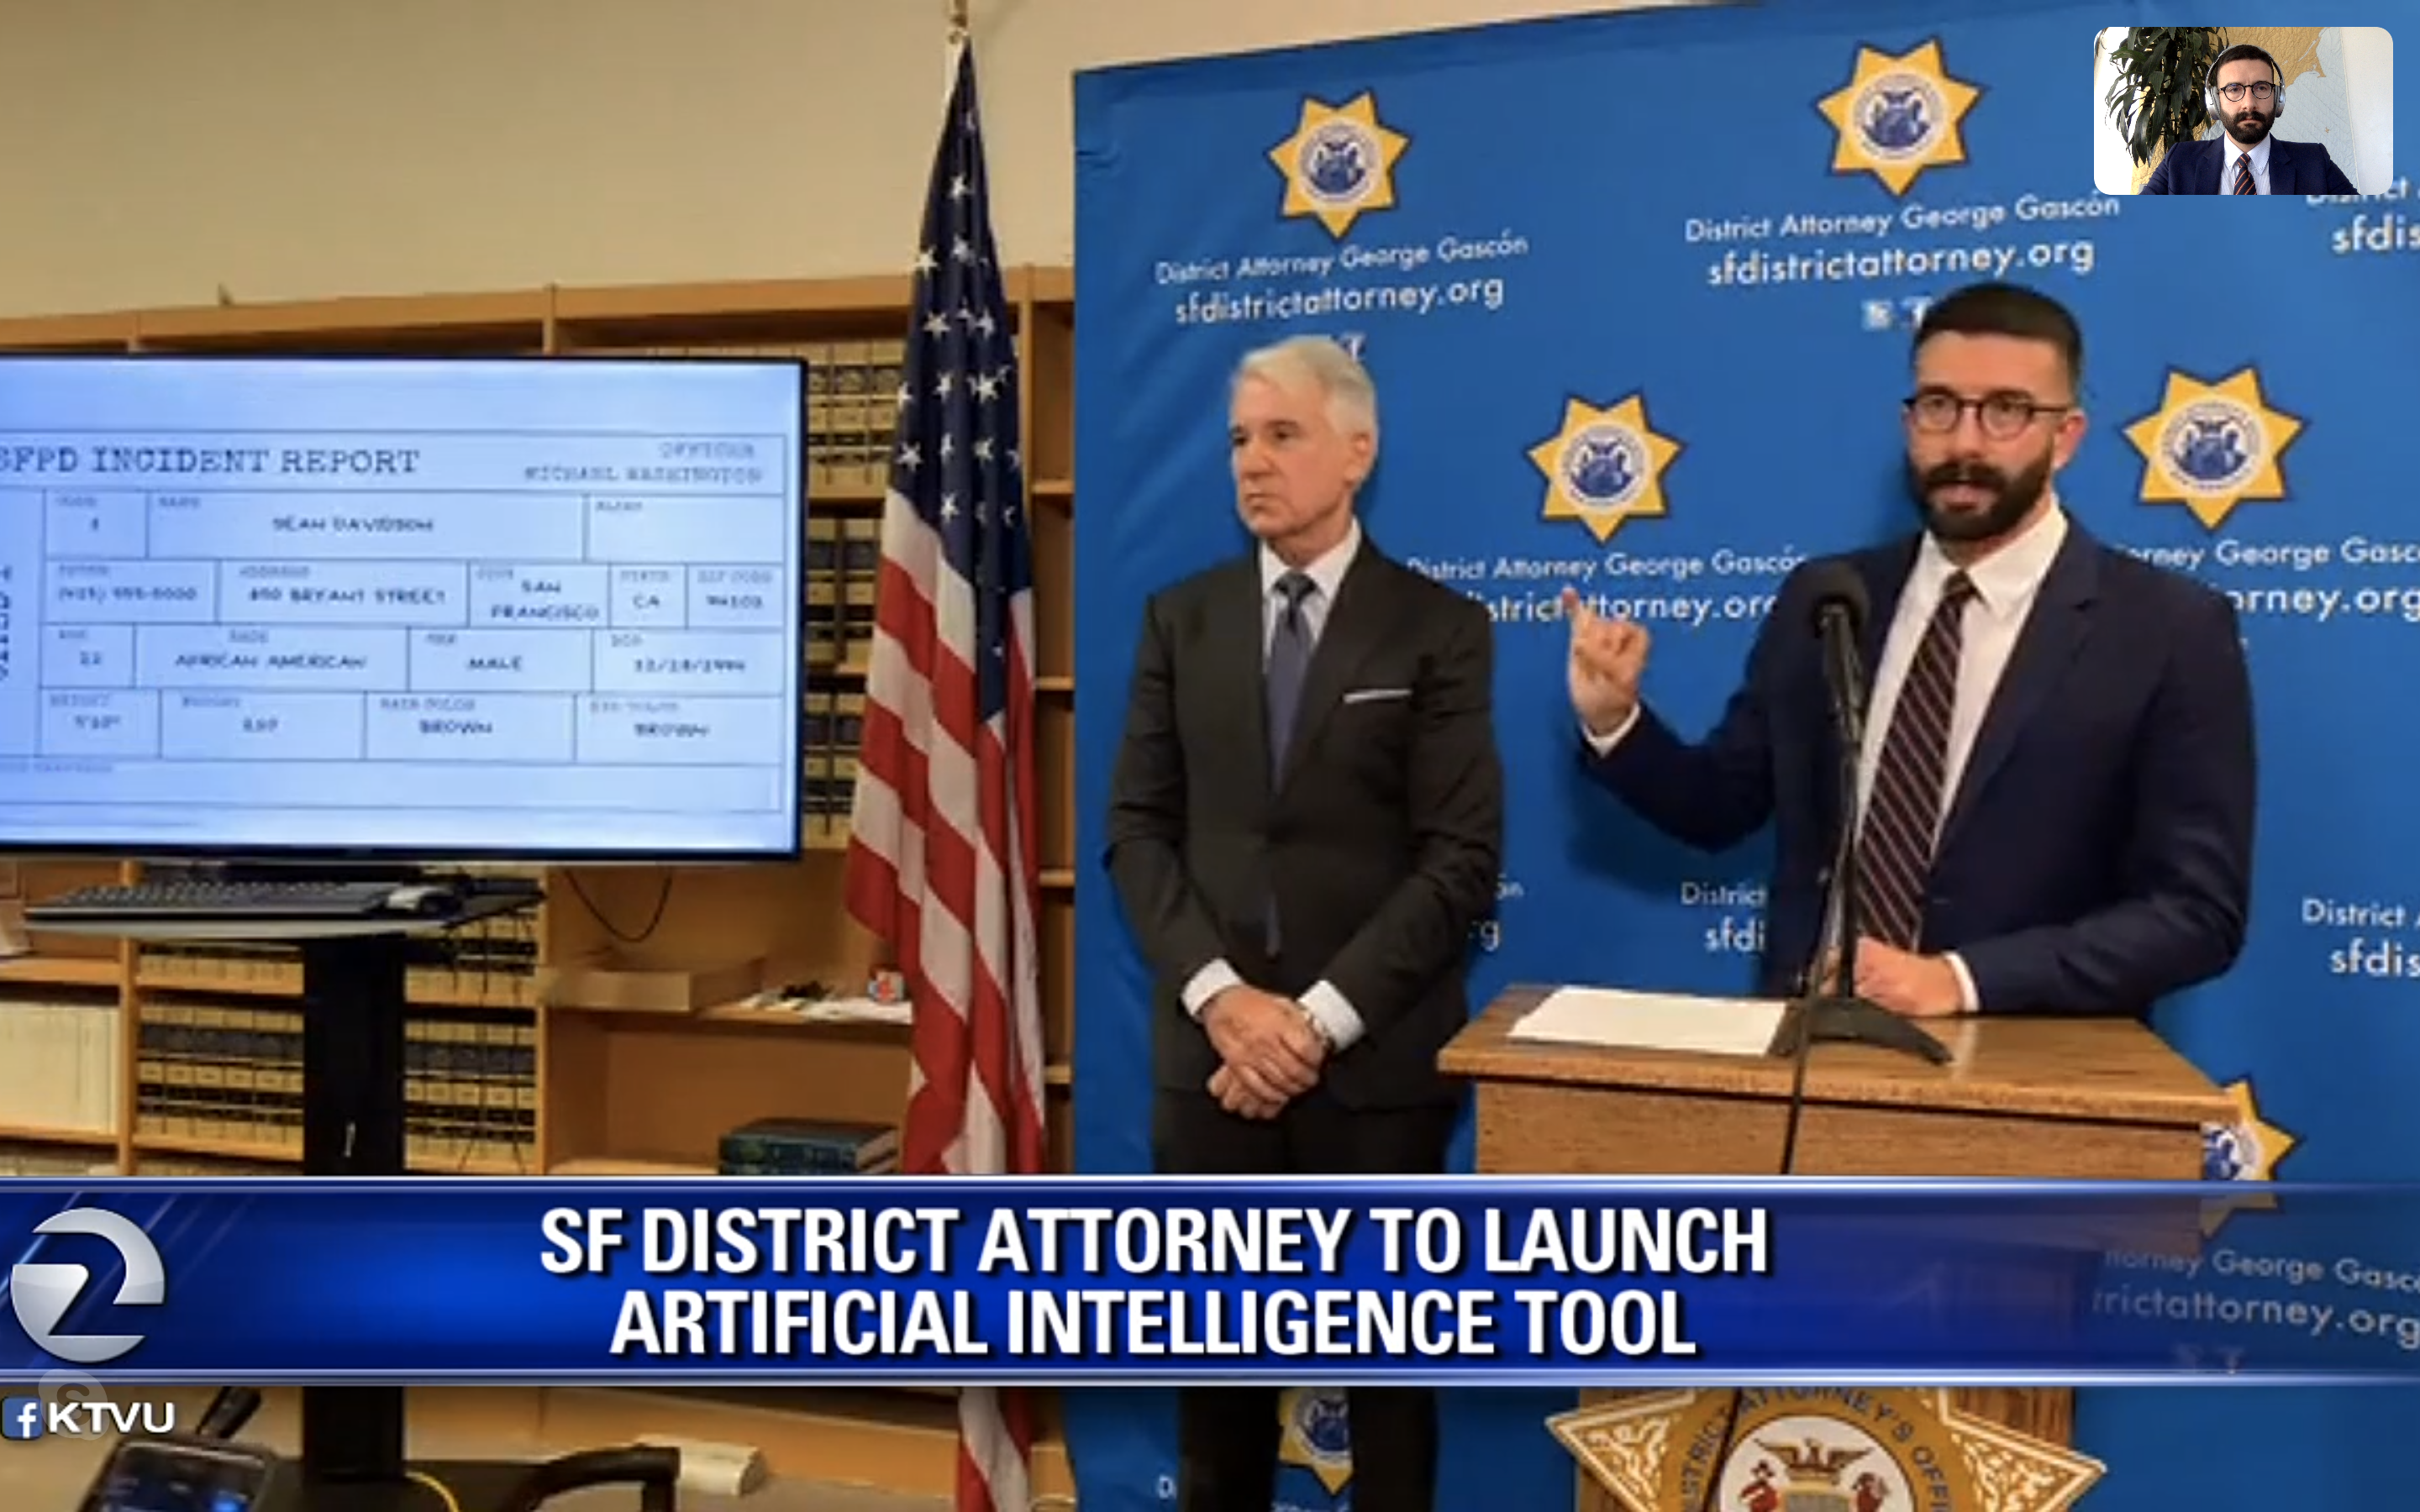
    A screenshot from a nightly newscast showing Alex Chohlas-Wood presenting race-blind charging at a press conference next to George Gascón.
    A screenshot from a nightly newscast showing Alex Chohlas-Wood presenting race-blind charging at a press conference next to George Gascón.
    With colleagues at CPL, I designed an algorithm that uses LLMs to automatically mask race-related information in police reports. Prosecutors then review these redacted reports, helping them avoid implicit bias when deciding whether to charge or dismiss a case. After we ran pilots at the San Francisco and Yolo District Attorney’s offices, California passed a law requiring prosecutors across the state to adopt our intervention. We are now studying the impacts of blind charging with a randomized controlled trial. Blind charging has been covered in numerous press articles. Learn more at blindcharging.org.
  • Learning to be fair

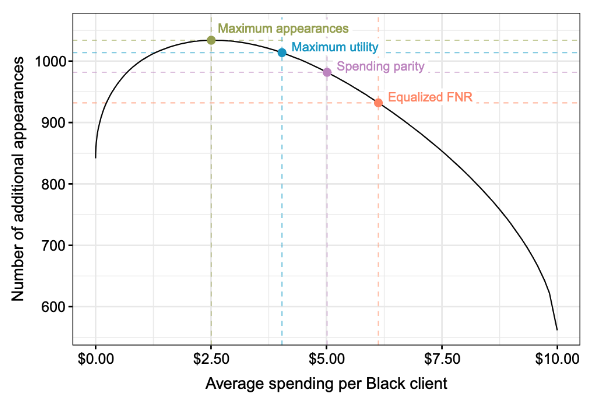
    A plot of a Pareto curve, showing an inherent tradeoff in a ride assistance program. On one axis is the number of new court appearances; on the other axis is the average spending per Black client. The graph shows a downward sloping curve, illustrating that it is not possible to maximize both new court appearances and average spending per Black client. On the chart are four possible allocations, showing that several commmon algorithmic approaches do not maximize a stakeholders' assumed maximium utility.
    A plot of a Pareto curve, showing an inherent tradeoff in a ride assistance program. On one axis is the number of new court appearances; on the other axis is the average spending per Black client. The graph shows a downward sloping curve, illustrating that it is not possible to maximize both new court appearances and average spending per Black client. On the chart are four possible allocations, showing that several commmon algorithmic approaches do not maximize a stakeholders' assumed maximium utility.
    Many studies have framed algorithmic fairness as a mathematical problem, proposing axiomatic constraints without fully considering the consequences of these constraints. My coauthors and I devised a new approach that uses contextual bandits and convex optimization to achieve equitable outcomes. We demonstrate the advantages of this approach using data from the Santa Clara Public Defender in a paper in Management Science.
  • Pretrial nudges

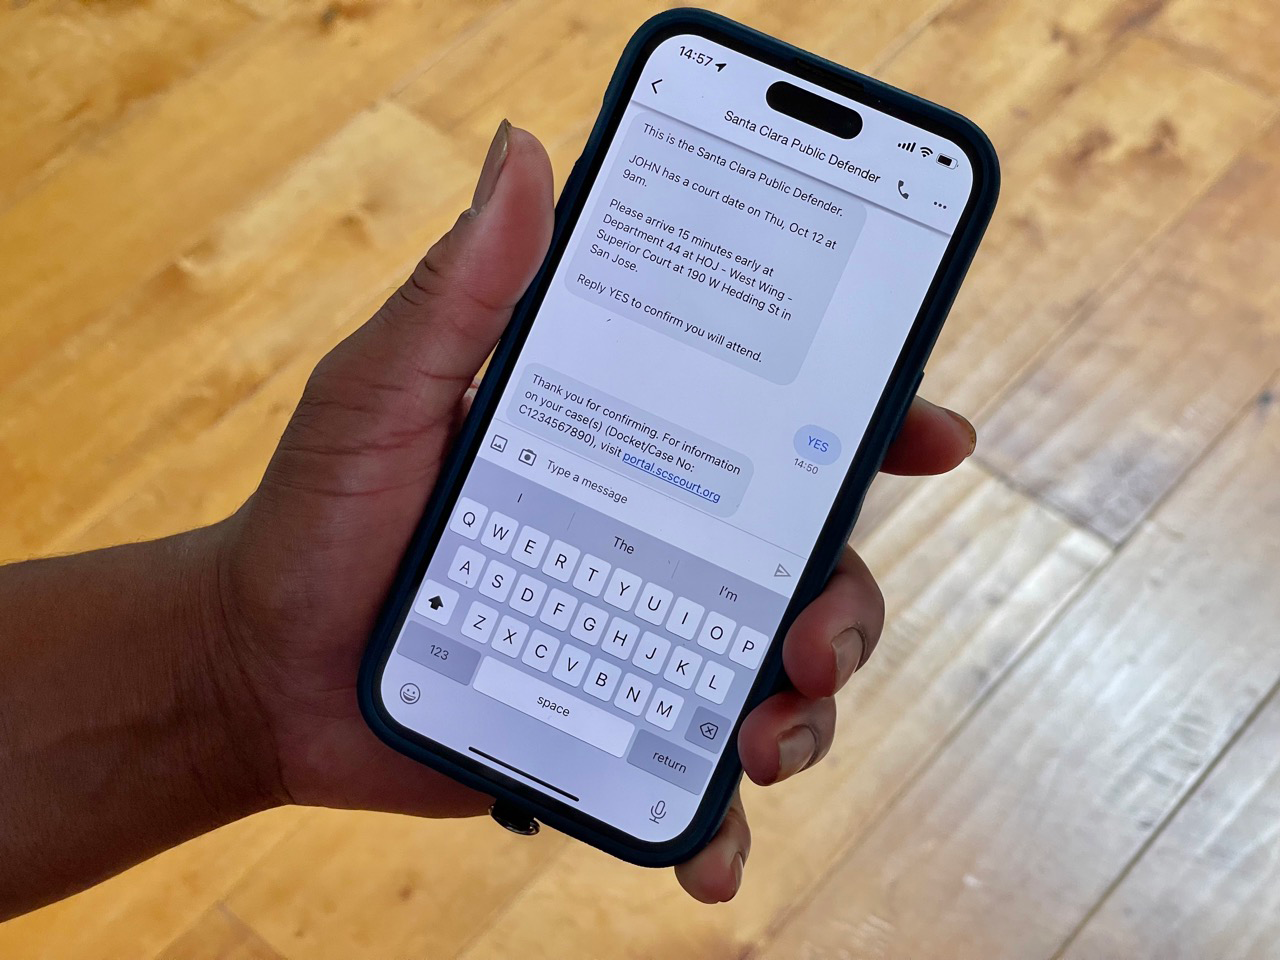
    An illustration of a text message reminder that encourages a fictional client to attend court.
    An illustration of a text message reminder that encourages a fictional client to attend court.
    Failing to appear in court can land a person in jail and cause them to lose their job or housing. But many people fail to appear (FTA) simply because they forget about their court date. In a randomized controlled trial at the Santa Clara Public Defender’s Office, we found that text message reminders reduced FTA-related jail involvement by over 20%. Our findings extend previous studies which found that text message reminders can help people show up to court. We’re now testing whether the standard consequences-focused reminder hurts or helps certain clients, and whether monetary assistance can help clients overcome financial barriers to court attendance.
  • Equitable algorithms

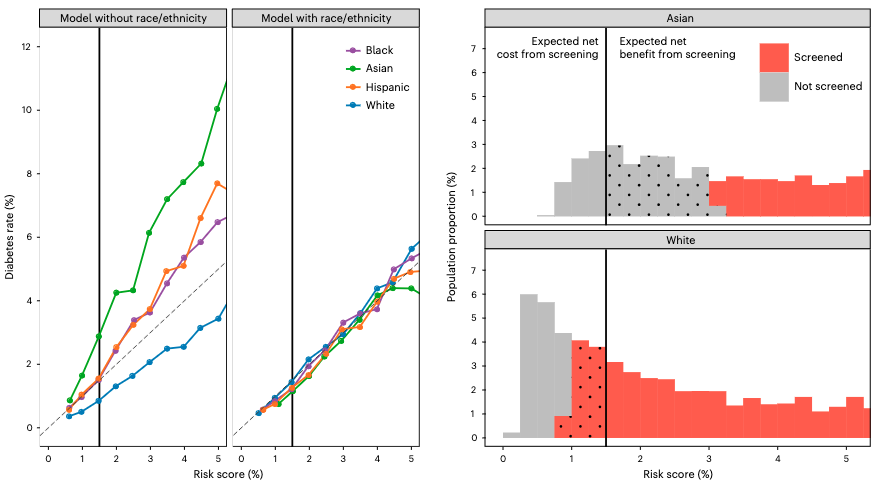
    Two plots of data side-by-side. On the left, two panes showing diverging and overlapping lines for risk assessment ratings for patients of different races or ethnicities. On the right, a stacked pair of histograms showing which patients would be referred to a diabetes exam.
    Two plots of data side-by-side. On the left, two panes showing diverging and overlapping lines for risk assessment ratings for patients of different races or ethnicities. On the right, a stacked pair of histograms showing which patients would be referred to a diabetes exam.
    The last few years have seen an explosion in research on how to constrain algorithms to avoid biased decision-making. My colleagues and I wrote a short guide for Nature Compuational Science that synthesizes this research, illustrates drawbacks to several widely cited approaches, and outlines practical steps people can take in their quest for equitable algorithms.
  • Disparate impact in policing

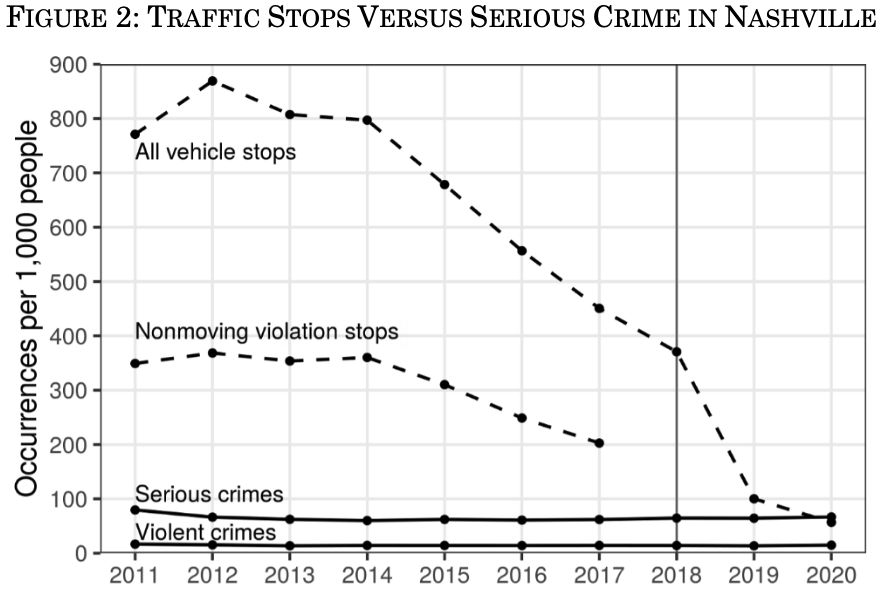
    A chart showing changing rates of police stop and criminal activity from Nashville, Tennessee.
    A chart showing changing rates of police stop and criminal activity from Nashville, Tennessee.
    In a paper, my colleagues and I described how data analysis can identify and measure racially disparate impacts in police stop policies, complementing other research which investigates whether bias exists in individual stops. We gave applied examples from a handful of major cities across the U.S., including Nashville, New York, Chicago, and Philadelphia. Our paper was published in the University of Chicago Law Review, and I wrote a Twitter thread about it here.
  • COVID-19 oriented reforms

    A thumbnail of the Washington Post op-ed referred to in the post.
    A thumbnail of the Washington Post op-ed referred to in the post.
    In a Washington Post piece, I argued (with colleagues from CPL) that the dramatic—but temporary, and patchwork—criminal justice reforms enacted in response to COVID-19 should be made permanent and expanded across the country.
  • Risk assessment instruments

    A thumbnail of the Brookings article mentioned in the post.
    A thumbnail of the Brookings article mentioned in the post.
    I wrote a briefer on the potential advantages and risks of using risk assessment instruments in criminal justice settings for the Brookings Institute’s “AI and Bias” series on fairness in algorithms.
  • Patternizr

    A thumbnail from an AP story linked to in the post.
    A thumbnail from an AP story linked to in the post.
    I helped design and deploy a tool called Patternizr that helps speed up the investigation of serious historical crimes. My colleague and I described our approach in a paper in the INFORMS Journal of Applied Analytics, including a first-of-its-kind analysis from a police department that demonstrates the tool does not disproportionately recommend any specific race group. Patternizr was featured in several articles.
  • Nashville police department

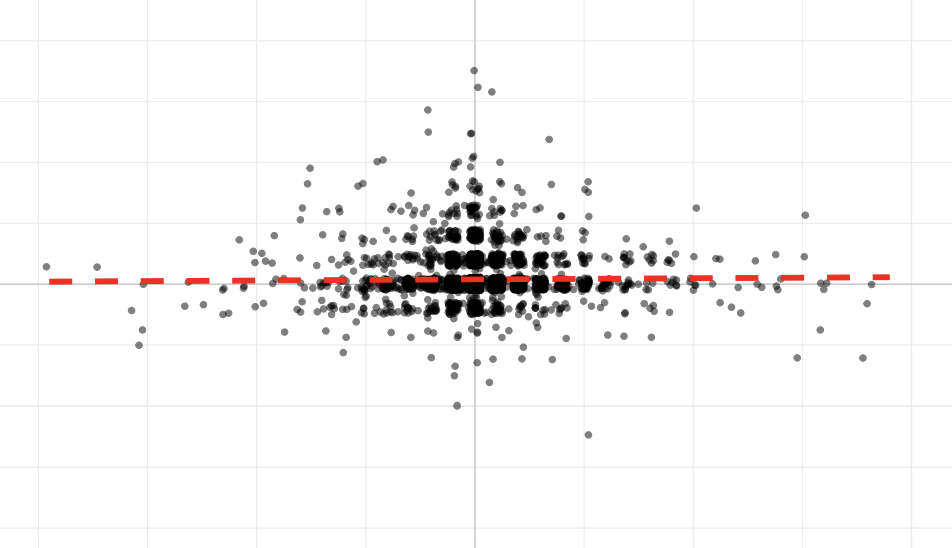
    A scatterplot with data centered around the origin and a flat dashed trend line in red.
    A scatterplot with data centered around the origin and a flat dashed trend line in red.
    I worked with colleagues at CPL on a project with the city of Nashville to demonstrate that traffic stops were an ineffective tool for fighting crime. Since the release of our report, the city’s police department has reduced the use of traffic stops by 70%—an almost 90% reduction from their peak.
  • Auditron

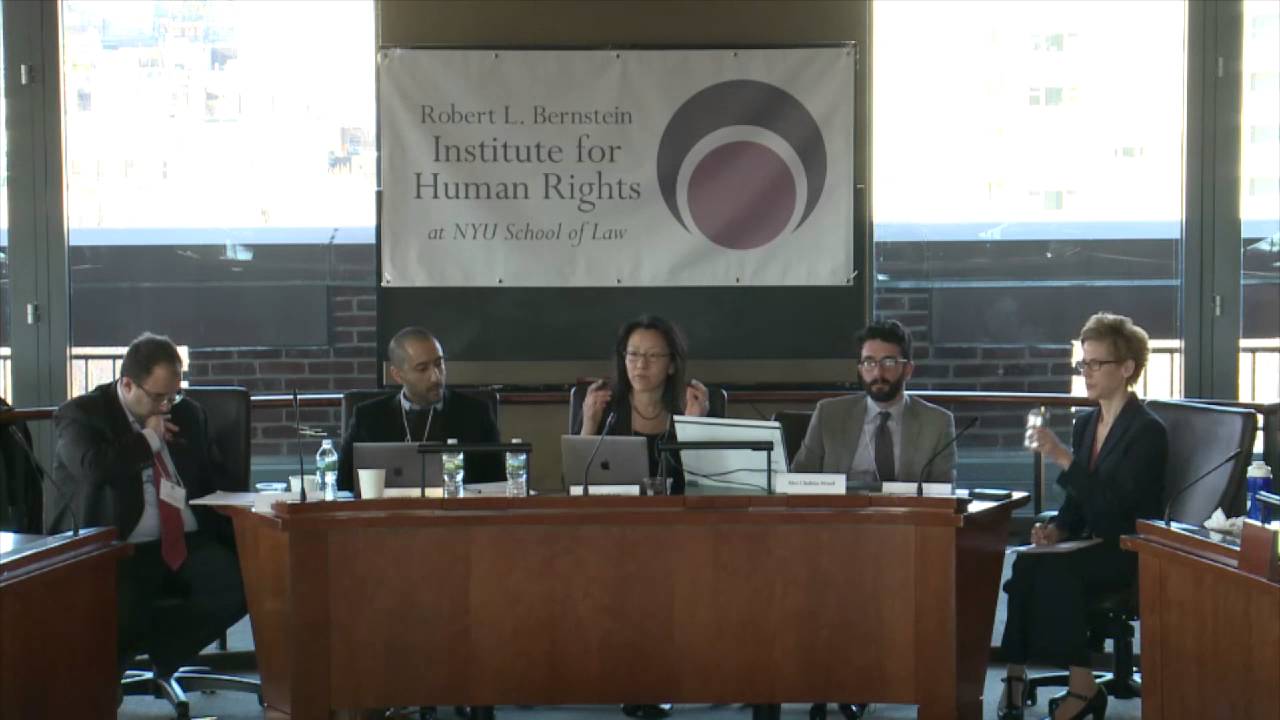
    A video still of the conference panel with Alex Chohlas-Wood as one of the presenters.
    A video still of the conference panel with Alex Chohlas-Wood as one of the presenters.
    I designed an algorithm for the NYPD that looked for crimes which were misclassified as felonies or misdemeanors. Likely misclassifications were sent to an internal team for auditing and correction. I presented my approach at NYU’s Tyranny of the Algorithm? Predictive Analytics & Human Rights conference.